Author Archives: admin

How to Create a Correlation of Multiple Time Series in R

With a matrix of data like this (you should calculate correlations on returns, but absolute prices are used here for the example):

excelpic

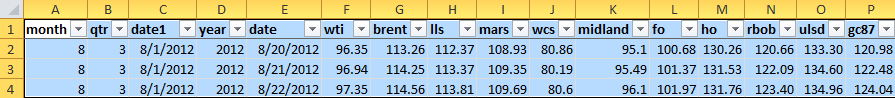
Name your desired column vectors:

> wti = data$wti
> brent = data$brent
> lls = data$lls
> mars = data$mars


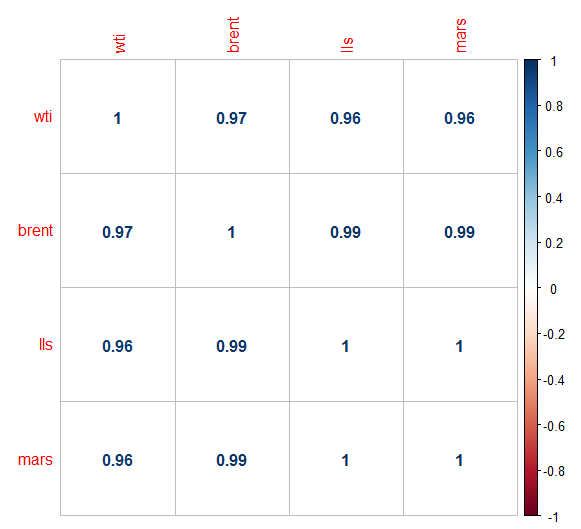
> dataframe = data.frame(wti,brent,lls,mars)
> COR = cor(dataframe)
> head(round(COR,2))
       wti brent  lls mars
wti   1.00  0.97 0.96 0.96
brent 0.97  1.00 0.99 0.99
lls   0.96  0.99 1.00 1.00
mars  0.96  0.99 1.00 1.00


If the correlation matrix comes back with “NA”s, use the na.omit command:

> clean = na.omit(dfrm)
> cor(clean)


Load “corrplot” package:

> library(corrplot)


> corrplot(COR,method = "number")


corrplot

See here for more on corrplot:

https://cran.r-project.org/web/packages/corrplot/vignettes/corrplot-intro.html

The R Cookbook has good information.

How to Subset a Vector by Another Vector in R

You have a matrix like this:

excelpic

You want to only look at Q1 prices for the spread between two products.  You can subset the price vectors by the qtr vector like this:

gcq116 = data[data$qtr==1,c("gc87q116")]
rbobq116 = data[data$qtr==1,c("rbobq116")]


Create the date vector:

> dateqtr1 = data[data$qtr==1,c("date")]


You now have two price vectors showing only the Q1 prices.  Graph the spread between the two vectors like this:

> qplot(dateqtr1,gcq116 - rbobq116)


which returns this:

subset prices

Adding Multiple ablines of Different Weights and Colors to Describe Statistics of a Time Series in R

As before, we have a qplot of a time series of prices.  We want to get quantiles of the time series and add ablines at those values.  We have a price vector called “price” and are interested in its 25th, 50th, and 75th percentiles.

> quantile(price,c(.25,.50,.75))
      25%       50%       75% 
-15.73075 -11.94800  -8.73450


The 50th percentile is called the median, and we also want to see the mean:


> mean(price)
[1] -12.0265


The median is greater than the mean, meaning that the price series’ distribution is skewed to the left (more points toward the right but more extreme values to the left).

We can see that by plotting the density function of “price”:

> qplot(price,geom="density")


which gives us this graph, which is slightly skewed to the left:

price density

Again, we create the qplot like this:

> m = qplot(date,price)


Then we add the ablines at the 25th, 75th, and 50th percentiles, using “lwd” and “col” to customize them:

> m + geom_abline(intercept = -11.95, slope = 0,lwd = 2, col="blue") + geom_abline(intercept = -15.73, slope = 0,lwd=1) + geom_abline(intercept = -8.73,slope = 0,lwd=1)


Which returns this graph:

time series abline

Update:

For a more efficient code, embed the statistics in the abline:

> m + geom_abline(intercept = mean(price), slope = 0,lwd = 2, col="blue") + geom_abline(intercept = quantile(price,.25), slope = 0,lwd=1,col="red") + geom_abline(intercept = quantile(price,.75),slope = 0,lwd=1, col="red")


Brooks Adams on the Limits of Consolidation and Centralization

Brooks Adams, the great-grandson of John Adams and grandson of John Quincy Adams, saw danger in the consolidation of power in a centralized State, as opposed to the dispersion of power envisioned (by many, but not all, of the founders) at the nation’s founding.  He wtote about it in The Law of Civilization and Decay.  Again from The Conservative Mind:

“Just how far the acceleration of the human movement may go it is impossible to determine; but it seems certain that, sooner or later, consolidation, having reached its limit, will necessarily stop.  There is nothing stationary in the universe.  Not to advance is to go backward, and when a highly centralized society disintegrates under the pressure of economic competition, it is because the energy of the race has been exhausted.”

I might amend Adams’ use of the word “economic” and instead use “political”, for economic power becomes subsumed to political power as that power is centralized.  Economic power is then redistributed from the central power, the State in D.C., back to its original geographic sources in the provinces, but this time to the State’s preferred hands, those who play the game and know how to feed power and what to ask in return.

This centralized State, being short-sighted and greedy, unable to plan, able only to maximize today’s gains at tomorrow’s expense, is doomed to break apart.  It may voluntarily relinquish some of its powers, but that is a sign that it is desperate, and that the relinquishing of power has only begun and will soon take on a life of its own.


Facets on a QPlot Time Series

How do you break the previous chart into yearly charts with the same abline?  You use facets.

This is why you should have month, quarter, and year columns in your daily price matrix.

Using the same line of code as before, add the facets command:

> p = qplot(date,wcswti16,facets = .~year)
> p + geom_abline(intercept = -15, slope = 0)


Get this:

wcswti16 facets

Time Series with QPlot with a Horizontal Line in R

You want to graph a time series of prices using qplot in the ggplot2 program.

First create the date and price vectors.  The price vector will be the spread between two separate prices:

> date = data$date
> wcswti16 = data$wcs16 - data$wti16


Call the qplot, with the date vector as the x-axis and the spread as the y axis, “p”.  Then add an abline to p at the y-axis point of your choice:

> p = qplot(date,wcswti16)
> p + geom_abline(intercept = -15, slope = 0)


This is the result:

wcswti16

The Drug War and the Mexican Brain Drain

From Justin Raimondo:

“The drug cartels have inaugurated a reign of terror in Mexico with little resistance from the government. And they are outfitted with military-grade weaponry, including handheld rocket launchers and even makeshift tanks. The government forces, riddled with corruption, have in effect ceded large areas to the cartels, prompting the rise ofcitizens’ militias to fight the criminal gangs alone. The government’s response has been to attack the militias, while leaving the cartels largely alone.

Rife with violence, and increasingly insecure for the Mexican upper and middle classes, Mexico is experiencing a massive brain drain. In the year 2000, there were 300,000 college-educated Mexican nationals living in the US: ten years later there were 530,000. Over a third of those with doctorate degrees live here. In addition to the escalating chaos, Mexican professionals and academics come to the US because their home country doesn’t have the resources, the infrastructure, or the inclination to make it possible for them stay and work in their chosen fields.

The Mexican government is well aware of this problem, and in response has initiated a “Program for Retention and Return.” However, this is unlikely to attract many expatriates unless conditions at home improve markedly and in very short order – or unless Trump is elected President and gets to implement his plan to deport all 11 million “illegals,” strictly limit legal immigration, and dam the southern border.”

The Radical Opponents of Conservatism

Kirk, after giving his six canons of conservative thought, turns to cataloging the schools of radicalism and gives a broad outline of their thoughts.  The schools he gives are:

Their attacks on conservative social order are based on:

  • “The perfectibility of man and the illimitable progress of society:  meliorism
  • “Contempt for tradition.  Reason, impulse, and materialistic determinism are severally preferred as guides to social welfare, trustier than the wisdom of our ancestors”
  • Political levelling.  Order and privilege are condemned; total democracy, as direct as practicable, is the professed radical ideal”
  • Economic levelling.  The ancient rights of property, especially property in land, are suspect to almost all radicals”

Radicals are neoterists.  (The link is to something about post-neoterism, which is more interesting than anything out there about neoterism.)  Change is sought for its own sake.

What is Conservatism?

I have long considered myself a libertarian, but with conservative leanings, where conservative implies a respect for established customs, beliefs, cultures, and social organization.  It relies on bottom-up social processes and resorts to governmental re-ordering only when necessary to ensure negative rights.

I compare this to what today, at least in the U.S., is called liberalism, which is a system of belief which holds that the human condition can be improved by top-down engineering and that material progress is the paramount concern of those in need of the social engineers’ help, often referred to as the masses.  I here use “masses” less as a socioeconomic descriptor and more as a state of mind, which is dominant in all classes of American society today.

Conservatism is hard to pin down because it is not an ideology (I am not talking about anything that has to do with the Republican Party in this post).  It is more a mode of thought that is as varied as the persons contemplating its meaning.  There is no orthodox conservatism as there is Marxism or even libertarianism, with its Non-Aggression Axiom.

In an attempt to sharpen my thinking as to what conservatism really is, I read Russell Kirk’s foundational The Conservative Mind:  From Burke to EliotIt would take thousands of posts to do the book justice, but I’ll start with what Kirk calls the six canons of conservative thought:

  • “Belief in a transcendent order, or body of natural law, which rules society as well as conscience.”
  • “Affection for the proliferating variety and mystery of human existence, as opposed to the narrowing uniformity, egalitarianism, and utilitarian aims of more radical systems.”
  • “Conviction that civilized society requires orders and classes, as against the notion of a ‘classless society’.”
  • “Persuasion that freedom and property are closely linked:  separate property from private possession, and Leviathan becomes master of all.”
  • “Faith in prescription and distrust of ‘sophisters, calculators, and economists’ who would reconstruct society upon abstract designs.”
  • “Recognition that change may not be salutary reform:  hasty innovation may be a devouring conflagration, rather than a torch of progress.”


Creating Charts in R

I’ve been moving all of my energy trading analysis from Excel to R.  Excel has a low entry cost, in terms of learning curve, and is used everywhere, so most people stay with it.  A program like R, however, is vastly more powerful and useful for anything but the most basic analysis.  The difficult part is getting over the steep (relative to Excel) learning curve before giving up and falling back to Excel.

Most people in energy trading have a spreadsheet with a matrix of prices and other data like this.  You should have columns for month, quarter, year, etc. for faceting R graphs.  More about that later:

excelpic

After downloading R and RStudio (both free), get the xlsx package, which allows you to upload Excel files into R, by typing this in:

> library(xlsx)

Upload the Excel price matrix into R from wherever your spreadsheet is saved.  sheetName is the name of the tab you want in the workbook:

> data = read.xlsx(“c:/R/correlations.xlsx”,sheetName = “bbls”)                     

Get the ggplot2 graphics package from R.  This offers much better graphics and ease of use than the base R graphics system:

> library(ggplot2)

Write this code in R to name your date, WTI crude price, and Brent crude price vectors:

> date = data$date


> wti = data$wti
> brent = data$brent


Then type this.  Qplot stands for quick plot and is the base graph in ggplot2:

> qplot(date,wti,geom="line")


You get this chart:

qplot2

After this brief setup it is already easier than charting in Excel.

Update:

To change line color and line weight, add these commands:

> qplot(date,wti,geom = "line",color = I("red"),size = I(1))


Giving:

qplot line