Category Archives: Derivatives Pricing

The message of the forward curve

From Reuters today:

“In late 2014 and again in late 2015, traders and refiners raced to buy as much crude as possible and put it into storage to profit from a big contango structure in the futures market.

But the strategy depends on the contango remaining wide enough to cover all the costs of financing and storing the physical crude.

As the contango in Brent narrows sharply, strategies which depend on selling Brent futures are becoming unprofitable (Hedge funds bet on tightening oil market despite Doha debacle, Reuters, April 19).

To the extent traders and refiners are financing and storing extra stock with Brent futures, the barrels are likely to be sold if the market remains in a narrow contango or moves deeper into backwardation.”

Volatility and Interest Rates

Volatility is low across many asset classes.  If volatility is a measure of uncertainty, then this is a bit strange.  These seem to be some of the most confusing economic times in recent history, with ever present calls for market crashes while stock markets move up, bonds stay very high, and oil moves sideways.

Central bank policy has provided strength to most markets, as they are designed to do.  This has in effect reduced downside volatility.  Oil is trading at less than 20% implied volatility, well below historic levels, even as economic uncertainty is high.  Oil production in the U.S. is growing and should be putting downward pressure on oil, but prices have been moving sideways since 2011.  Why would $100 WTI, with rising supply and economic crashes always around the corner, be trading at <20% implied put side volatility?

At least part of the answer seems to involve central bank policy.  Low interest rates have sent money out to non-traditional markets in search of yield.  Commodities like oil benefit from this.  Low interest rates also incentivize oil producers to keep oil in the ground.  If their option is to put their proceeds from oil sales into low to negative real rate paying treasuries, then why not wait?  Lastly, the money used by central banks to buy the bonds that keep interest rates low needs a home.  The new money is a wealth transfer from savers to the receivers of the new money, so there is a constant flow of real, not nominal, savings to the bondholders.  They will be looking for somewhere to invest the money.  These three factors, put in place because of the uncertainty the world faces, have led to the paradox of lower volatility in the face of greater uncertainty.

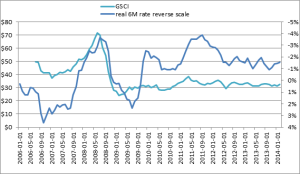
Below is a chart showing the Goldman Sachs commodity index with real 6 month interest rates:

image001


Potential Future Exposure for a Derivatives Position

Potential Future Exposure (PFE) is a simple way to measure the riskiness of a derivatives portfolio, given some statistical assumptions about the distribution of future prices of the derivative portfolio’s underlying assets.  These assumptions are wrong, but not so wrong that the PFE will not provide some valuable information. The PFE uses the model of the underlying asset price process that the Black-Scholes option formula uses, and therefore shares the same assumptions, so the PFE can illustrate some of its limitations.

The PFE is easy to model in Excel.  We start with the asset price process,

ST = Ste(r – 1/2σ^2)(T-t) +/- σZ(T-t)^2

which is described here and here. For this example I have taken the WTI Crude Oil Cal13 prices as the underlying, meaning we have a portfolio of derivatives: futures, forwards, options, or a mixture of all of them with WTI as the underlying.

The r for each month will be the LIBOR rate of corresponding term, the sigma will be the implied volatility taken from the option on each contract month, and the Z will be a confidence level that we set.  Here we use 95%, or 1.65 (standard deviations).  In Excel, use NORMSINV(.95) to get 1.65.  If our assumptions were correct, which they aren’t, 95% of the time the portfolio’s worst loss would be inside the interval we create.

Apply the above formula to each contract month, adding the second term (with the Z factor) to get the upper interval and subtracting to get the lower, and using each month’s specific r, sigma, and time to expiration for each monthly contract (T-t), and we get this result:

It is a simple matter to get an exposure in dollar terms.  We take the portfolio’s exposure in barrels, net the longs and shorts for each month, and multiply each month’s underlying by each month’s corresponding price on the lower curve (since we would be losing if the underlying went down).  If the portfolio has options, treat them as being delta barrels long or short.  This works since the option delta is calculated using the same r, sigma, S, and (T-t) as our underlying process uses here.

Note that the upper bound is farther away from the current forward curve than the lower bound.  This is due to the lognormal distribution of asset prices.  The downside is floored at zero and the upside is infinite.

Costless Collars and the Volatility Skew

Costless collars are one of the most-used hedging structures for commodity producers.  In this structure, the downside protection, the put option, is financed by selling a call.  In other words, the insurance against prices falling is paid for by giving up some of the upside in the case of a price rise.

The producer will set his downside protection target and then look at the call option market to see how much upside he will have to give up.  Say, for example, that the February WTI crude oil futures contract is currently at $89 and the at-the-money implied volatility is 27% annualized.  If the producer wants to limit his downside at $80, he will have to pay $.53/bbl for the $80 strike put option.  He can sell a $99.50 strike call option for $.53/bbl to finance his put (this is assuming no bid/ask spread for simplicity).

The option market, however, never has the same volatility for different strikes, despite the assumptions of the Black-Scholes and Black 76 (which is used in this example) option pricing models.  In fact, the February $80 put option is trading with a 29.5% implied volatility.  The $99.50 call has a 25.5% implied volatility.  This is because the market is putting a higher likelihood on a down move than on an up move, and the producer will have to pay more for that.

The $80 put is selling for $.69/bbl, while the $99.50 call is selling for $.43/bbl.  The structure will not be costless.  A costless structure will have to include a call with a $97.25 strike.  The producer will have to give up $2.25/bbl more of upside potential than if the volatility across all strikes was the same as the at-the-money volatility.  This is the effect of the volatility skew.  The payoff of the structure will look like this, with the producer’s price following the market between $80 and $97.25:

N(d1) and N(d2) in the Black-Scholes Formula

N(d2) is the probability of exercise of an option with a lognormally distributed underlying following the standard BSM assumptions (drift is (r – .5σ2)(T-t)).  N(d2) defines the area of integration to give the probability of exercise and is

                Z > [ln(K/S) – (r – .5σ2)(T-t)]/σ*sqrt(T-t) = z0
meaning that the area of integration is z0 to ∞, or -∞ to  –z0, the part of the normal distribution where exercise takes place.  The option price formula can be viewed as a conditional expectation multiplied by a probability,
                e-r(T-t)[E[ST|ST > K]*N(d2) – K*N(d2)]
The conditional expectation E[ST|ST > K] can also be written as
                Se(r-.5σ^2)(T-t) + σ*sqrt(T-t)*Z
where the Z in the last term ensures that only values of the underlying S where exercise takes place are considered.  The greater the volatility σ, the greater the possible up move, the greater the area of integration, and hence the greater the conditional expectation of S.
The option price formula can now be written as
                e-r(T-t)[(Se(r-.5σ^2)(T-t) + σ*sqrt(T-t)*Z)*N(d2) – K*N(d2)]
The e(r-.5σ^2)(T-t) + σ*sqrt(T-t)*Z term can be combined with N(d2) since it is also a standard normal probability.  N(d1) is then just N(d2) +  σ*sqrt(T-t), which gives N(d1) a greater expectation based on σ.  The option price formula can now be written as
                e-r(T-t)[(Ser*N(d1) – K*N(d2)] or
                S*N(d1)- e-r(T-t)K*N(d2)
N(d1) simply takes into account the higher conditional expectation of the random underlying S versus the static K.

The Black-Scholes Differential Equation

dS = μSdt + σSdW is an Ito process with drift µ and diffusion W. The instantaneous change in W, dW, is a Brownian motion scaled by a constant σ. The increments of dW are normally distributed with mean 0 and standard deviation 1.

In Ito calculus, dt and dW behave like this when multiplied:
dWdW = dt
dtdW = 0
dtdt = 0

This means that
(dS)² = σ²S²dt.

If C is an option and S is its underlying asset then, applying Ito’s lemma and collecting terms, we get:

dC = (∂C/∂t)dt + (∂C/∂S)dS + ½(∂²C/∂S²)(dS)²

dC = (∂C/∂t)dt + (∂C/∂S)( μSdt + σSdW)
+ ½(∂²C/∂S²)σ²S²dt

dC = (∂C/∂t)dt + (∂C/∂S) μSdt + (∂C/∂S)σSdW
+ ½(∂²C/∂S²)σ²S²dt

dC = [(∂C/∂t) + μS(∂C/∂S) + ½(∂²C/∂S²) σ²S²]dt
+ (∂C/∂S)σSdW,

which is the change in the option’s value over small increments of time.

The first term, called an infinitesimal operator, has a standard, Newtonian derivative,dt, and the dW term has a stochastic, or random, derivative. To create a riskless position, the random term must be hedged away.

A position of one option and Δ shares of S is created, since all changes in the option’s value depend on changes in S. The portfolio is

Π = C + ΔS

The change in the portfolio’s value is

dΠ = dC + ΔdS.

Substituting dC and dS from above gives:

dΠ = [(∂C/∂t) + μS(∂C/∂S) + ½(∂²C/∂S²) σ²S²]dt + (∂C/∂S) σSdW + Δ[μSdt + σSdW]

and

dΠ = [(∂C/∂t) + μS(∂C/∂S) + ½(∂²C/∂S²) σ²S²]dt
+ (∂C/∂S) σSdW + ΔμSdt + ΔσSdW

Set

(∂C/∂S) σSdW + ΔσSdW = 0
to get rid of the random terms. This means that (∂C/∂S) = -Δ, and the risky terms cancel each other out, leaving

dΠ = [(∂C/∂t) + ½(∂²C/∂S²) σ²S²]dt
as the portfolio’s change in value under small changes in time. The portfolio is riskless now, so it has an expected growth of r, meaning

dΠ = rΠdt = r(C + ΔS)dt = r[C – (∂C/∂S)S]dt
Setting

r[C – (∂C/∂S)S]dt = [(∂C/∂t) + ½(∂²C/∂S²) σ²S²]dt
and cancelling terms gives

rC = (∂C/∂t) + r(∂C/∂S)S + ½(∂²C/∂S²) σ²S²
which is the Black-Scholes-Merton differential equation, a 2nd order parabolic partial differential equation. Notice that μ, the drift of the underlying S, is not in the equation. The only drift term is the risk free interest rate r.

Replacing each partial differential with its corresponding Greek letter gives

rC = Θ + rSΔ + ½ σ²S² Γ

where
∂C/∂t = Θ
∂C/∂S = Δ
∂²C/∂S² = Γ
Dynamics of the Lognormal Process Used in the Black-Scholes Formula

Start with the log return of a process, ln(ST/St)

Assume that S follows the process dSt = µdt + σdWt, where µ is drift, σ is volatility, and Wt is a random process that is N~(0,1)

Find the stochastic derivative of the process ln(S) using the Ito formula, dft = ft  + fs + 1/2  fss :

             dln(S) = 1/S(dS) – (1/2)(1/S2)(dS2)

             dln(S) = (µ – ½ σ2)dt + σdWt


This says that the logarithm of a random process that is normally distributed is concave and has a mean of (µ – ½ σ2) and that

             ln(ST/St) = ln(S1) – ln(S0) = (µ – ½ σ2)(T-t) + σ(W(T) – W(t))

             ln(ST) = ln(St) + (µ – ½ σ2)(T-t) + σ(W(T) – W(t))


Assume that St is lognormally distributed, meaning it is an exponentiated normal process.  Take the exponential of both sides of the above equation:

             ST = Ste(µ – 1/2σ^2)dt + σdWt


The lognormal process SeX, X ~ N(µ, σ), is convex and has a mean of (µ + ½ σ2), so the above equation has an expectation of

             ST = Steµt


since the- ½ σconcavity of the log of a normal and the + ½ σ2 implicit convexity in the exponentiated normal cancel each other and the expectation of dWt is 0.  This is necessary for the process St to be a martingale when µ = 0.