I’ve been moving all of my energy trading analysis from Excel to R. Excel has a low entry cost, in terms of learning curve, and is used everywhere, so most people stay with it. A program like R, however, is vastly more powerful and useful for anything but the most basic analysis. The difficult part is getting over the steep (relative to Excel) learning curve before giving up and falling back to Excel.
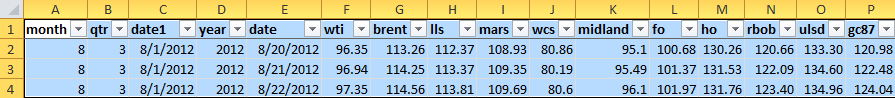
Most people in energy trading have a spreadsheet with a matrix of prices and other data like this. You should have columns for month, quarter, year, etc. for faceting R graphs. More about that later:
After downloading R and RStudio (both free), get the xlsx package, which allows you to upload Excel files into R, by typing this in:
> library(xlsx)
Upload the Excel price matrix into R from wherever your spreadsheet is saved. sheetName is the name of the tab you want in the workbook:
> data = read.xlsx(“c:/R/correlations.xlsx”,sheetName = “bbls”)
Get the ggplot2 graphics package from R. This offers much better graphics and ease of use than the base R graphics system:
> library(ggplot2)
Write this code in R to name your date, WTI crude price, and Brent crude price vectors:
> date = data$date
> wti = data$wti
> brent = data$brent
Then type this. Qplot stands for quick plot and is the base graph in ggplot2:
> qplot(date,wti,geom="line")
You get this chart:
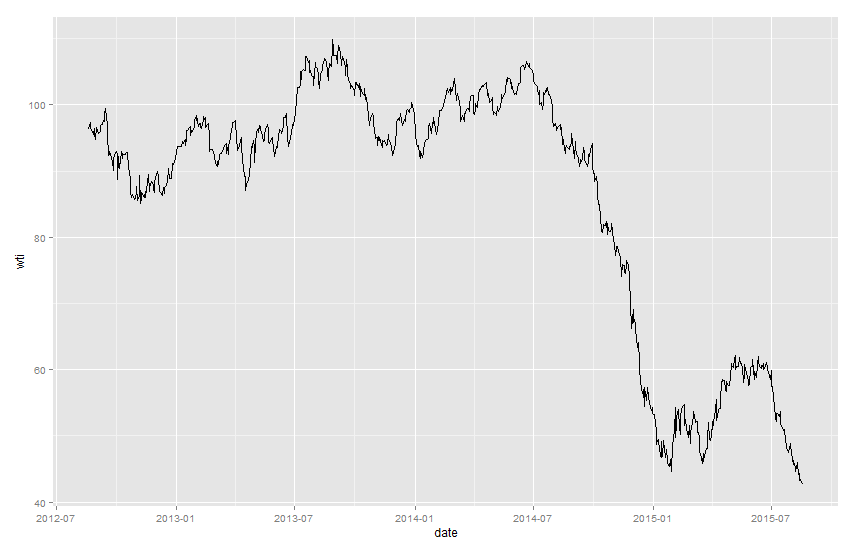
After this brief setup it is already easier than charting in Excel.
Update:
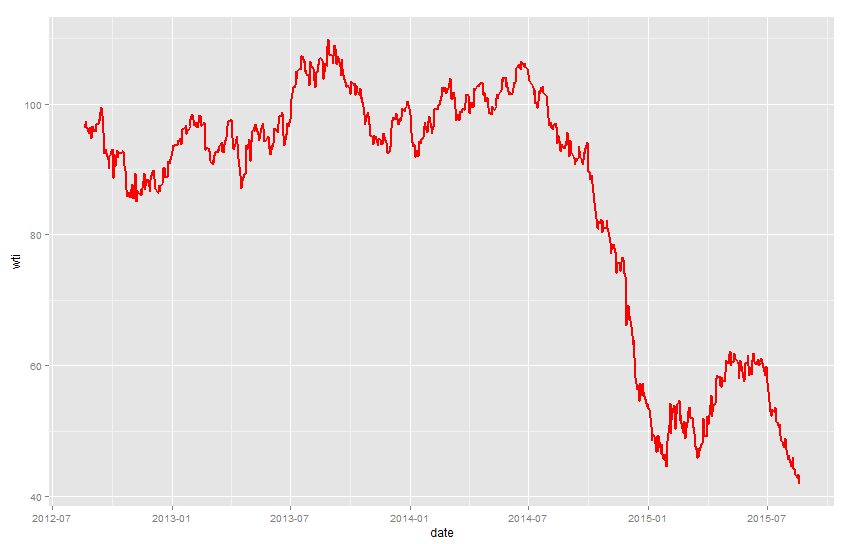
To change line color and line weight, add these commands:
> qplot(date,wti,geom = "line",color = I("red"),size = I(1))
Giving:
Thank you for sharing Mr Allen, very informative, R looks very exciting and I must admit that as you explained it seems like the grade of difficulty to get used to it should be moderate??, I hope some day I would be able to use it in my moving business.