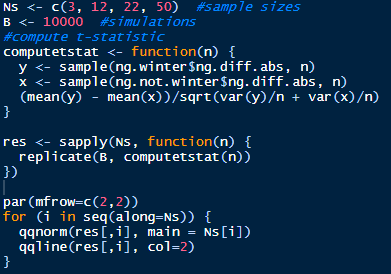
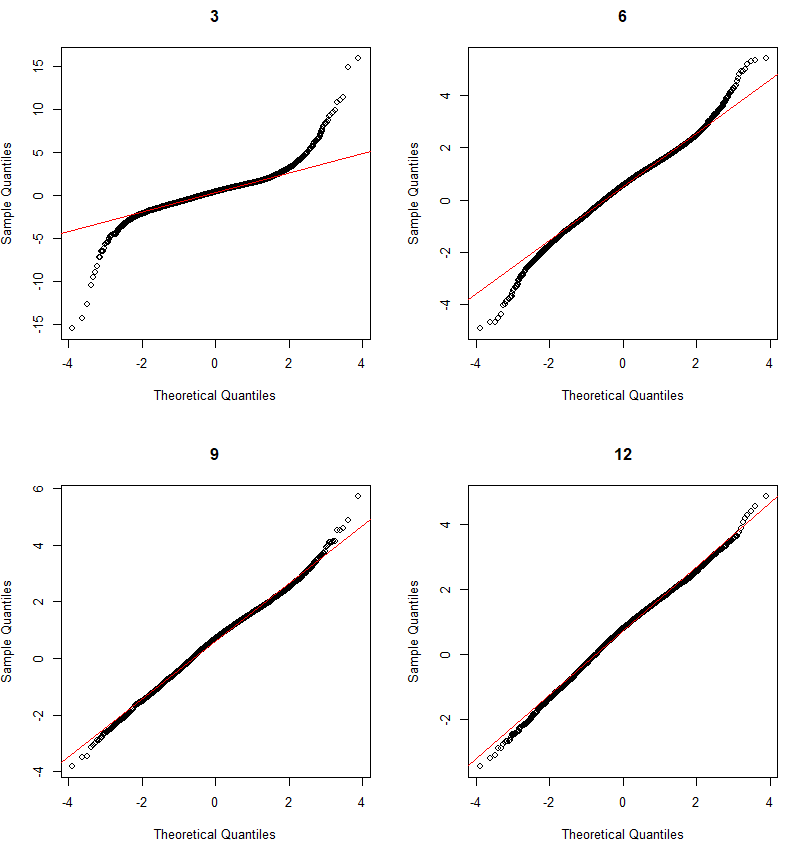
This example is similar to the previous example, with two changes: we are calculating the t-statistic instead of simply the difference in the means, and the function to calculate the t-stat is pre-defined and used in the sapply function. The Central Limit Theorem approximation looks pretty good for sample sizes as small as 12.
Again, reworking examples from the great Data Analysis for the Life Sciences using commodities data. This example is interesting because the authors show how to use sapply, while before they used for loops. One of the great benefits of this book is the use of more advanced functional programming and iteration techniques, both of which are used in this example.
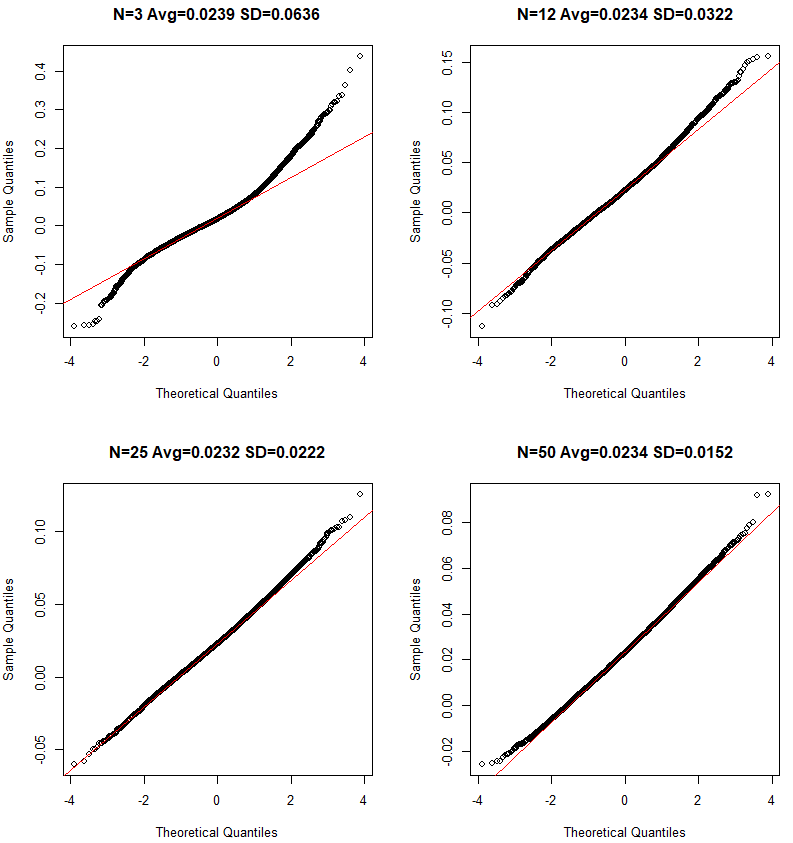
Here we are taking different sample sizes from the absolute values of the daily changes of winter natural gas and !winter natural gas and comparing the differences. We know that the 2010-today difference in the means is 0.0233, and that the standard deviation of the sample distribution should decrease as sample size increases.
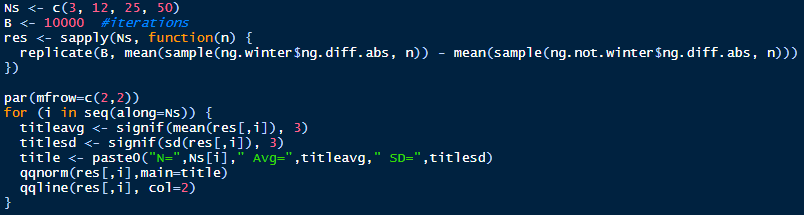
This code uses sapply to apply each of the four Ns to the user-created function inside sapply. It then uses a for loop to create charts for the results from each of the four sample sizes, adding the sample average and standard deviation in each title.