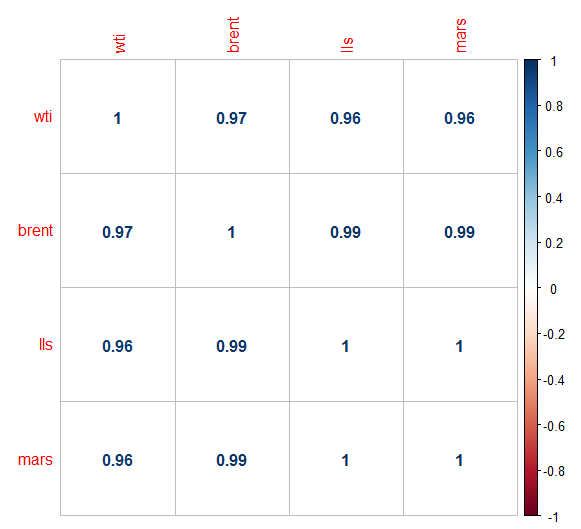
With a matrix of data like this (you should calculate correlations on returns, but absolute prices are used here for the example):
Name your desired column vectors:
> wti = data$wti
> brent = data$brent
> lls = data$lls
> mars = data$mars
> dataframe = data.frame(wti,brent,lls,mars)
> COR = cor(dataframe)
> head(round(COR,2))
       wti brent  lls mars
wti   1.00  0.97 0.96 0.96
brent 0.97  1.00 0.99 0.99
lls   0.96  0.99 1.00 1.00
mars  0.96  0.99 1.00 1.00
If the correlation matrix comes back with “NA”s, use the na.omit command:
> clean = na.omit(dfrm)
> cor(clean)
Load “corrplot” package:
> library(corrplot)
> corrplot(COR,method = "number")
See here for more on corrplot:
https://cran.r-project.org/web/packages/corrplot/vignettes/corrplot-intro.html
The R Cookbook has good information.

