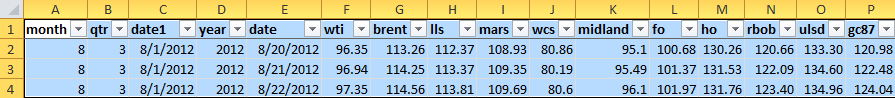
You have a matrix like this:
You want to only look at Q1 prices for the spread between two products. You can subset the price vectors by the qtr vector like this:
gcq116 = data[data$qtr==1,c("gc87q116")]
rbobq116 = data[data$qtr==1,c("rbobq116")]
Create the date vector:
> dateqtr1 = data[data$qtr==1,c("date")]
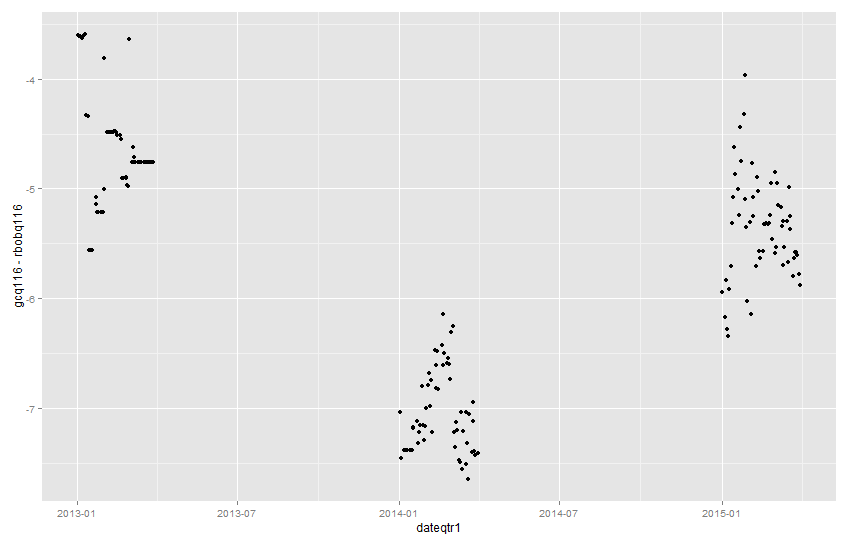
You now have two price vectors showing only the Q1 prices. Graph the spread between the two vectors like this:
> qplot(dateqtr1,gcq116 - rbobq116)
which returns this: