How do you break the previous chart into yearly charts with the same abline? You use facets.
This is why you should have month, quarter, and year columns in your daily price matrix.
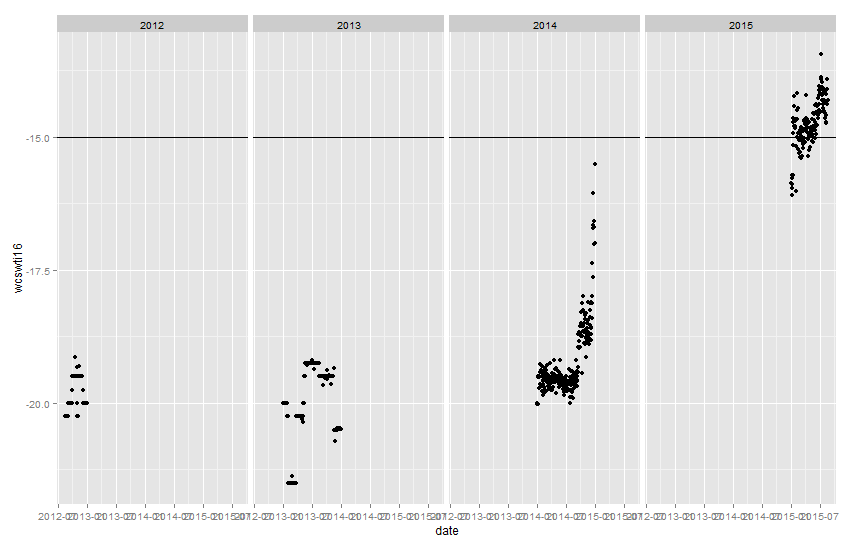
Using the same line of code as before, add the facets command:
> p = qplot(date,wcswti16,facets = .~year)
> p + geom_abline(intercept = -15, slope = 0)
Get this: