![]() Apparently R does not allow subsetting data by date, creating a dataframes, and then adding a text legend with the grid package. Instead, you can put date, series1, and series2 in one data frame and add each series one at a time to ggplot:
Apparently R does not allow subsetting data by date, creating a dataframes, and then adding a text legend with the grid package. Instead, you can put date, series1, and series2 in one data frame and add each series one at a time to ggplot:
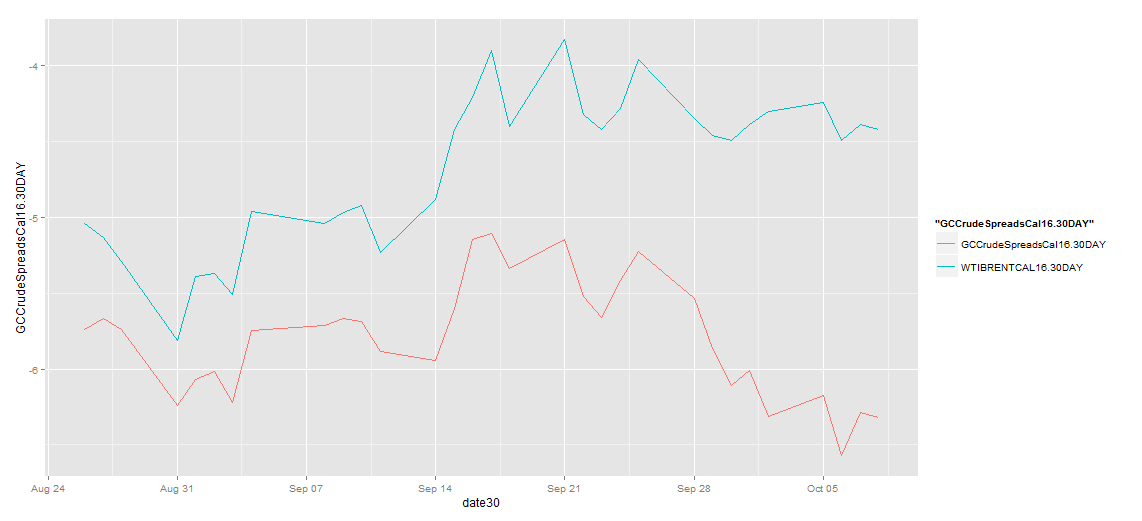
df.total = data.frame(date30,GCCrudeSpreadsCal16.30DAY,WTIBRENTCAL16.30DAY)
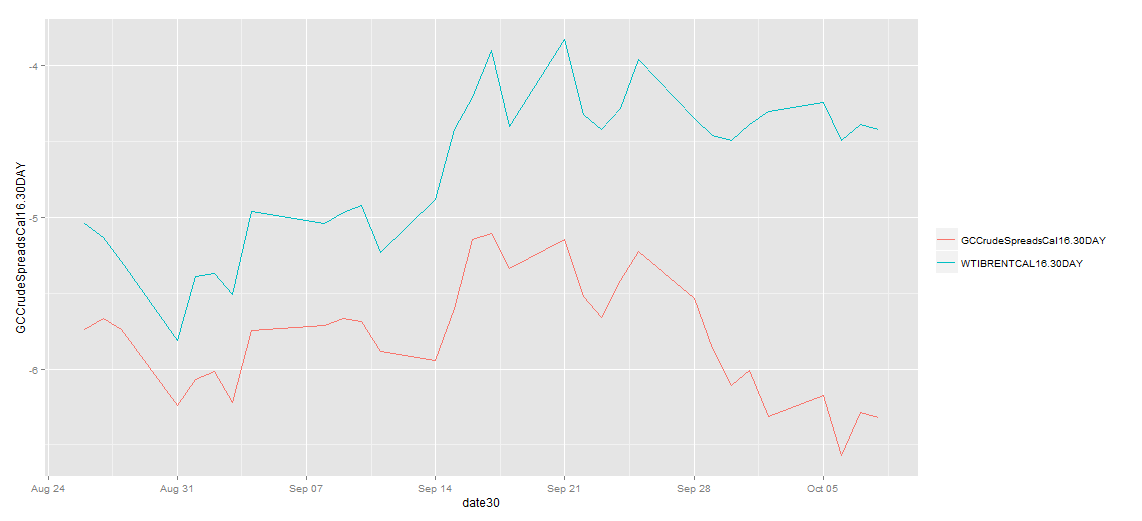
port = ggplot(df.total,aes(date30)) + geom_line(aes(y = GCCrudeSpreadsCal16.30DAY,color = “GCCrudeSpreadsCal16.30DAY”)) + geom_line(aes(y = WTIBRENTCAL16.30DAY,color = “WTIBRENTCAL16.30DAY”))
#remove legend title
port + theme(legend.title=element_blank())