> library(reshape2)
> library(ggplot2)
> date = data$date
> price1 = data$wti
> price2 = data$ulsd
> df = data.frame(date,price1,price2)
> df2 = melt(data = df,id.vars = "date")
> ggplot(data = df2,aes(x = date,y = value,color = variable)) + geom_line()
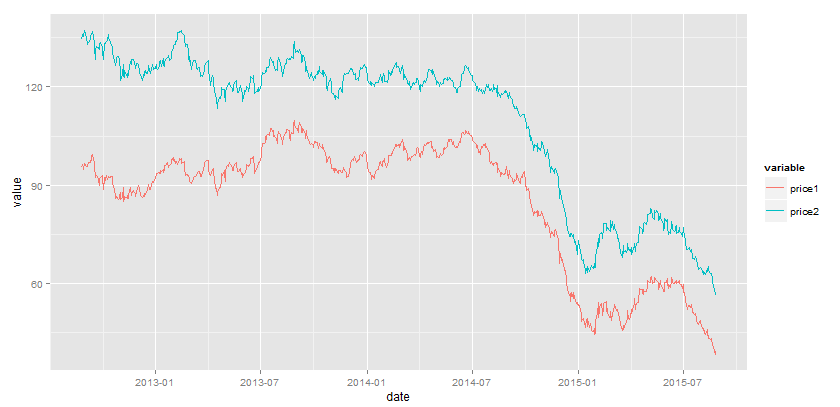
Add ylab and xlab for labels:
> a = ggplot(data = df2,aes(x = date,y = value,color = variable)) + geom_line()
> a + ylab("price")